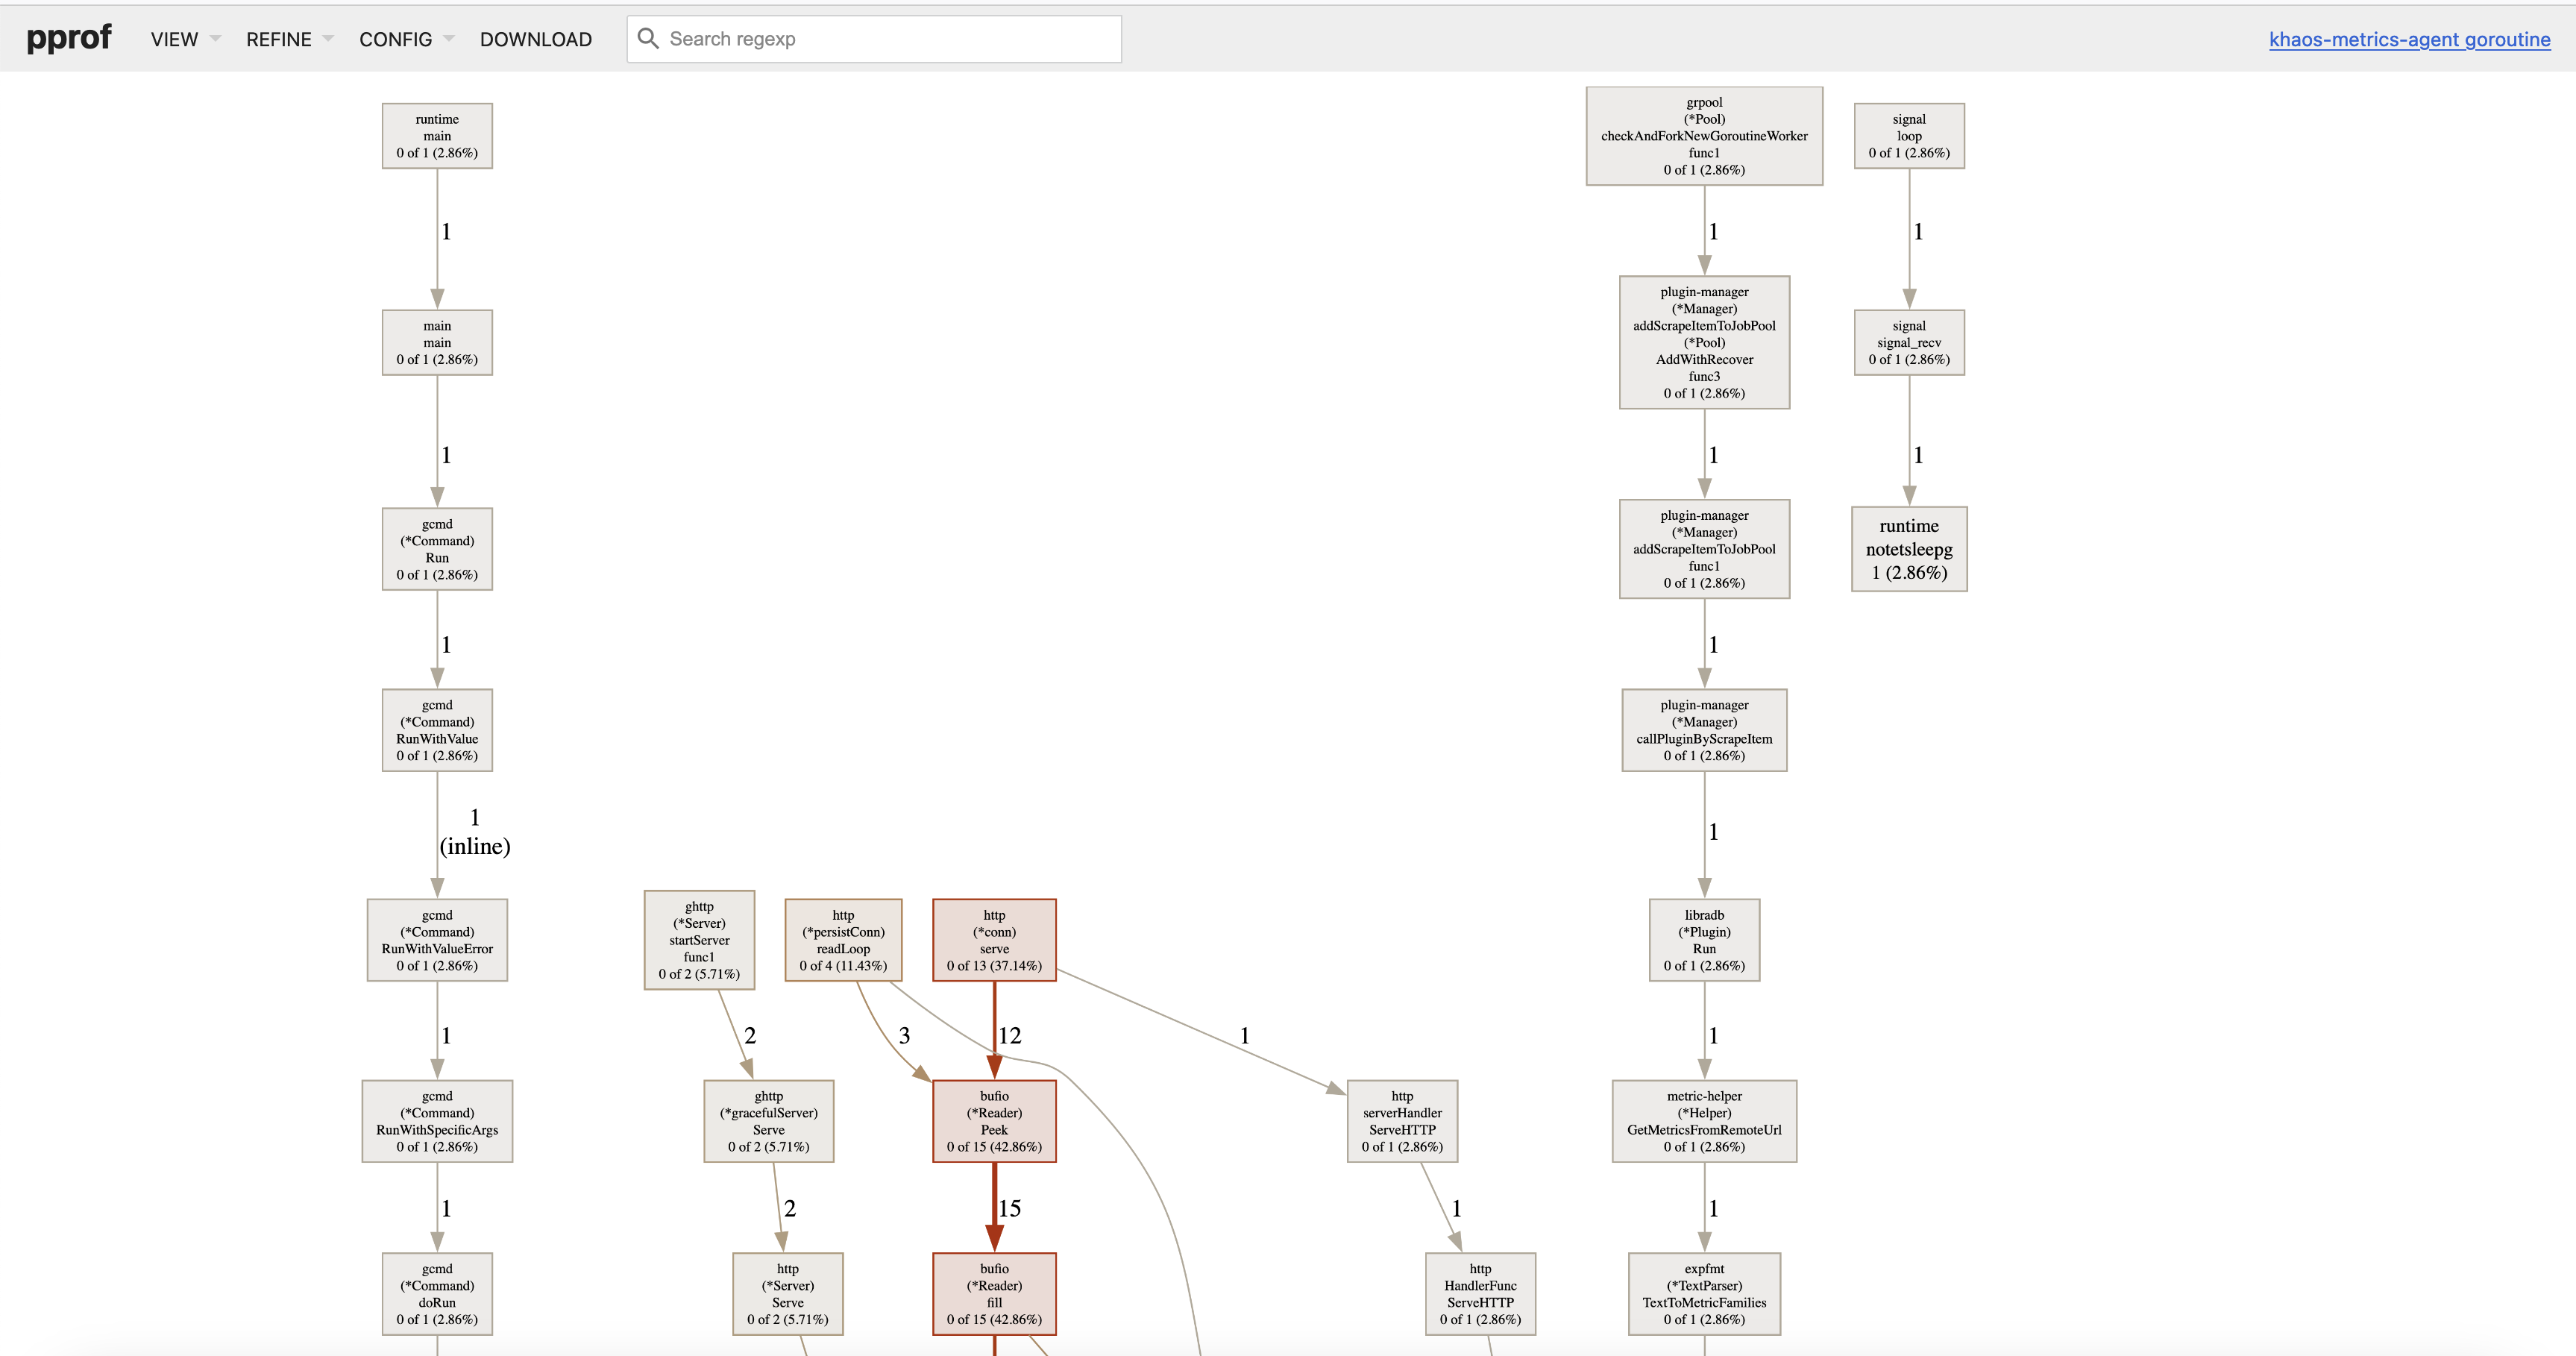
The GoFrame framework's Web Server offers a very robust and easy-to-use service performance analysis feature. It is perfectly integrated with the pprof performance analysis tool, which can be activated anytime via the EnablePProf method. You can also customize the route address for the performance analysis tool; if not provided, the default URI is /debug/pprof.
PProf Activation
The activation of the PProf feature will have some impact on program performance. The specific degree of influence should be compared before and after the PProf is enabled based on the current business scenario.
EnablePProf
Let's look at a simple example:
package main

import (
    "github.com/gogf/gf/v2/frame/g"
    "github.com/gogf/gf/v2/net/ghttp"
    "runtime"
)

func main() {
    runtime.SetMutexProfileFraction(1) // (optional) Enable lock call tracing
    runtime.SetBlockProfileRate(1)     // (optional) Enable blocking operation tracing

    s := g.Server()
    s.EnablePProf()
    s.BindHandler("/", func(r *ghttp.Request) {
        r.Response.Writeln("Hello World!")
    })
    s.SetPort(8199)
    s.Run()
}
This example uses s.EnablePProf() to enable performance analysis. By default, the following routes are registered:
/debug/pprof/*action
/debug/pprof/cmdline
/debug/pprof/profile
/debug/pprof/symbol
/debug/pprof/trace
Among these, /debug/pprof/*action is used for page access, and the others are prepared for the go tool pprof command.
StartPProfServer
You can also use the StartPProfServer method to quickly start an independent PProf Server, often used in long-running processes without an HTTP Server (such as cron jobs or GRPC services), for program performance analysis. The method is defined as:
func StartPProfServer(port int, pattern ...string)
In general, it is used in an asynchronous goroutine to run the PProf Server, typically like this:
package main

import (
    "github.com/gogf/gf/v2/net/ghttp"
)

func main() {
    go ghttp.StartPProfServer(8199)
    // Other services startup and running
    // ...
}
The above example can be improved to:
package main

import (
    "github.com/gogf/gf/v2/frame/g"
    "github.com/gogf/gf/v2/net/ghttp"
)

func main() {
    go ghttp.StartPProfServer(8299)

    s := g.Server()
    s.EnablePProf()
    s.BindHandler("/", func(r *ghttp.Request) {
        r.Response.Writeln("Hello World!")
    })
    s.SetPort(8199)
    s.Run()
}
PProf Metrics
heap: Reports memory allocation samples for monitoring current and historical memory usage and investigating memory leaks.threadcreate: Reports sections of the program that caused the creation of a new OS thread.goroutine: Reports stack traces of all currentgoroutines.block: Shows wheregoroutinesblock waiting on synchronization primitives (including timer channels). Not enabled by default; needsruntime.SetBlockProfileRateto enable.mutex: Reports lock contention. Not enabled by default; needsruntime.SetMutexProfileFractionto enable.
PProf Pages
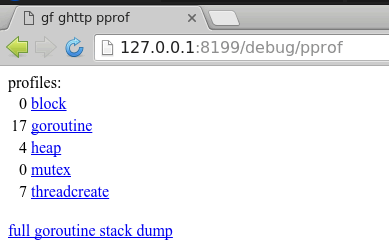
For simple performance analysis, directly accessing the /debug/pprof address is sufficient, and the content is as follows:
pprofpage
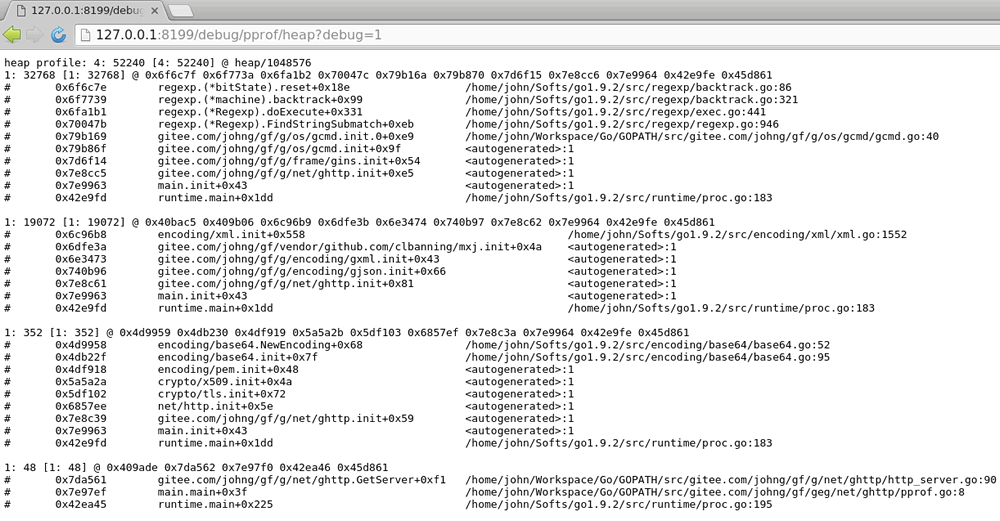
- Heap Usage
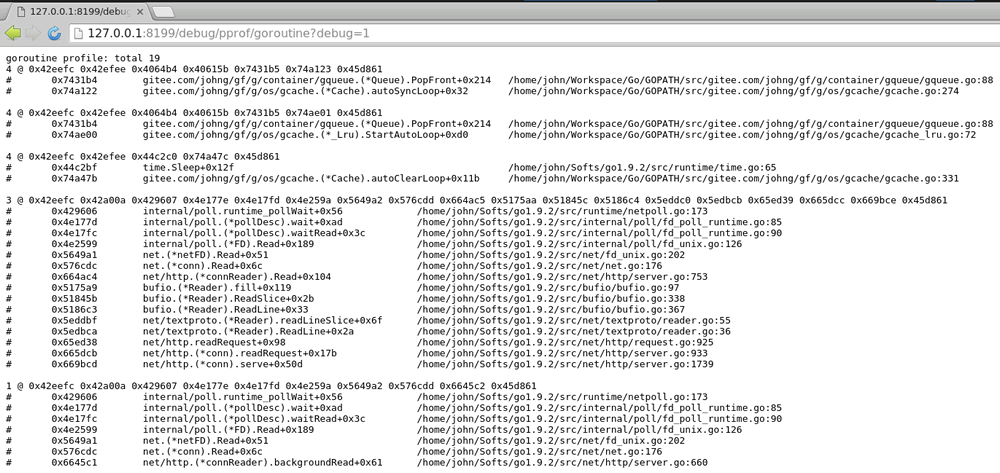
- Details of
goroutinesin the current process
Performance Data Collection and Analysis🔥
The screenshots in the examples below are sourced from sample projects and are for reference only.
For detailed performance analysis, the go tool pprof command-line tool is indispensable. After enabling performance analysis support, you can perform performance data collection and analysis with the following command:
go tool pprof -http :8080 "http://127.0.0.1:8199/debug/pprof/profile"
You can also export the pprof file and then open it with the go tool pprof command:
curl http://127.0.0.1:8199/debug/pprof/profile > pprof.profile
go tool pprof -http :8080 pprof.profile
After approximately 30 seconds of API data collection by the pprof tool (during which time the WebServer should have incoming traffic), a performance analysis report is generated. You can then view the report results using top10/web and other pprof commands. For more commands, use go tool pprof. For detailed usage of pprof, please refer to Golang's official documentation: blog.golang.org/profiling-go-programs
CPU Performance Analysis
The command line performance analysis result in this example is as follows:
$ go tool pprof -http :8080 "http://127.0.0.1:8199/debug/pprof/profile"
Serving web UI on http://localhost:8080
To display pprof graphically, the Graphviz graphical tool needs to be installed. For my current system, Ubuntu, install by executing sudo apt-get install graphviz (for MacOS, use brew install Graphviz).
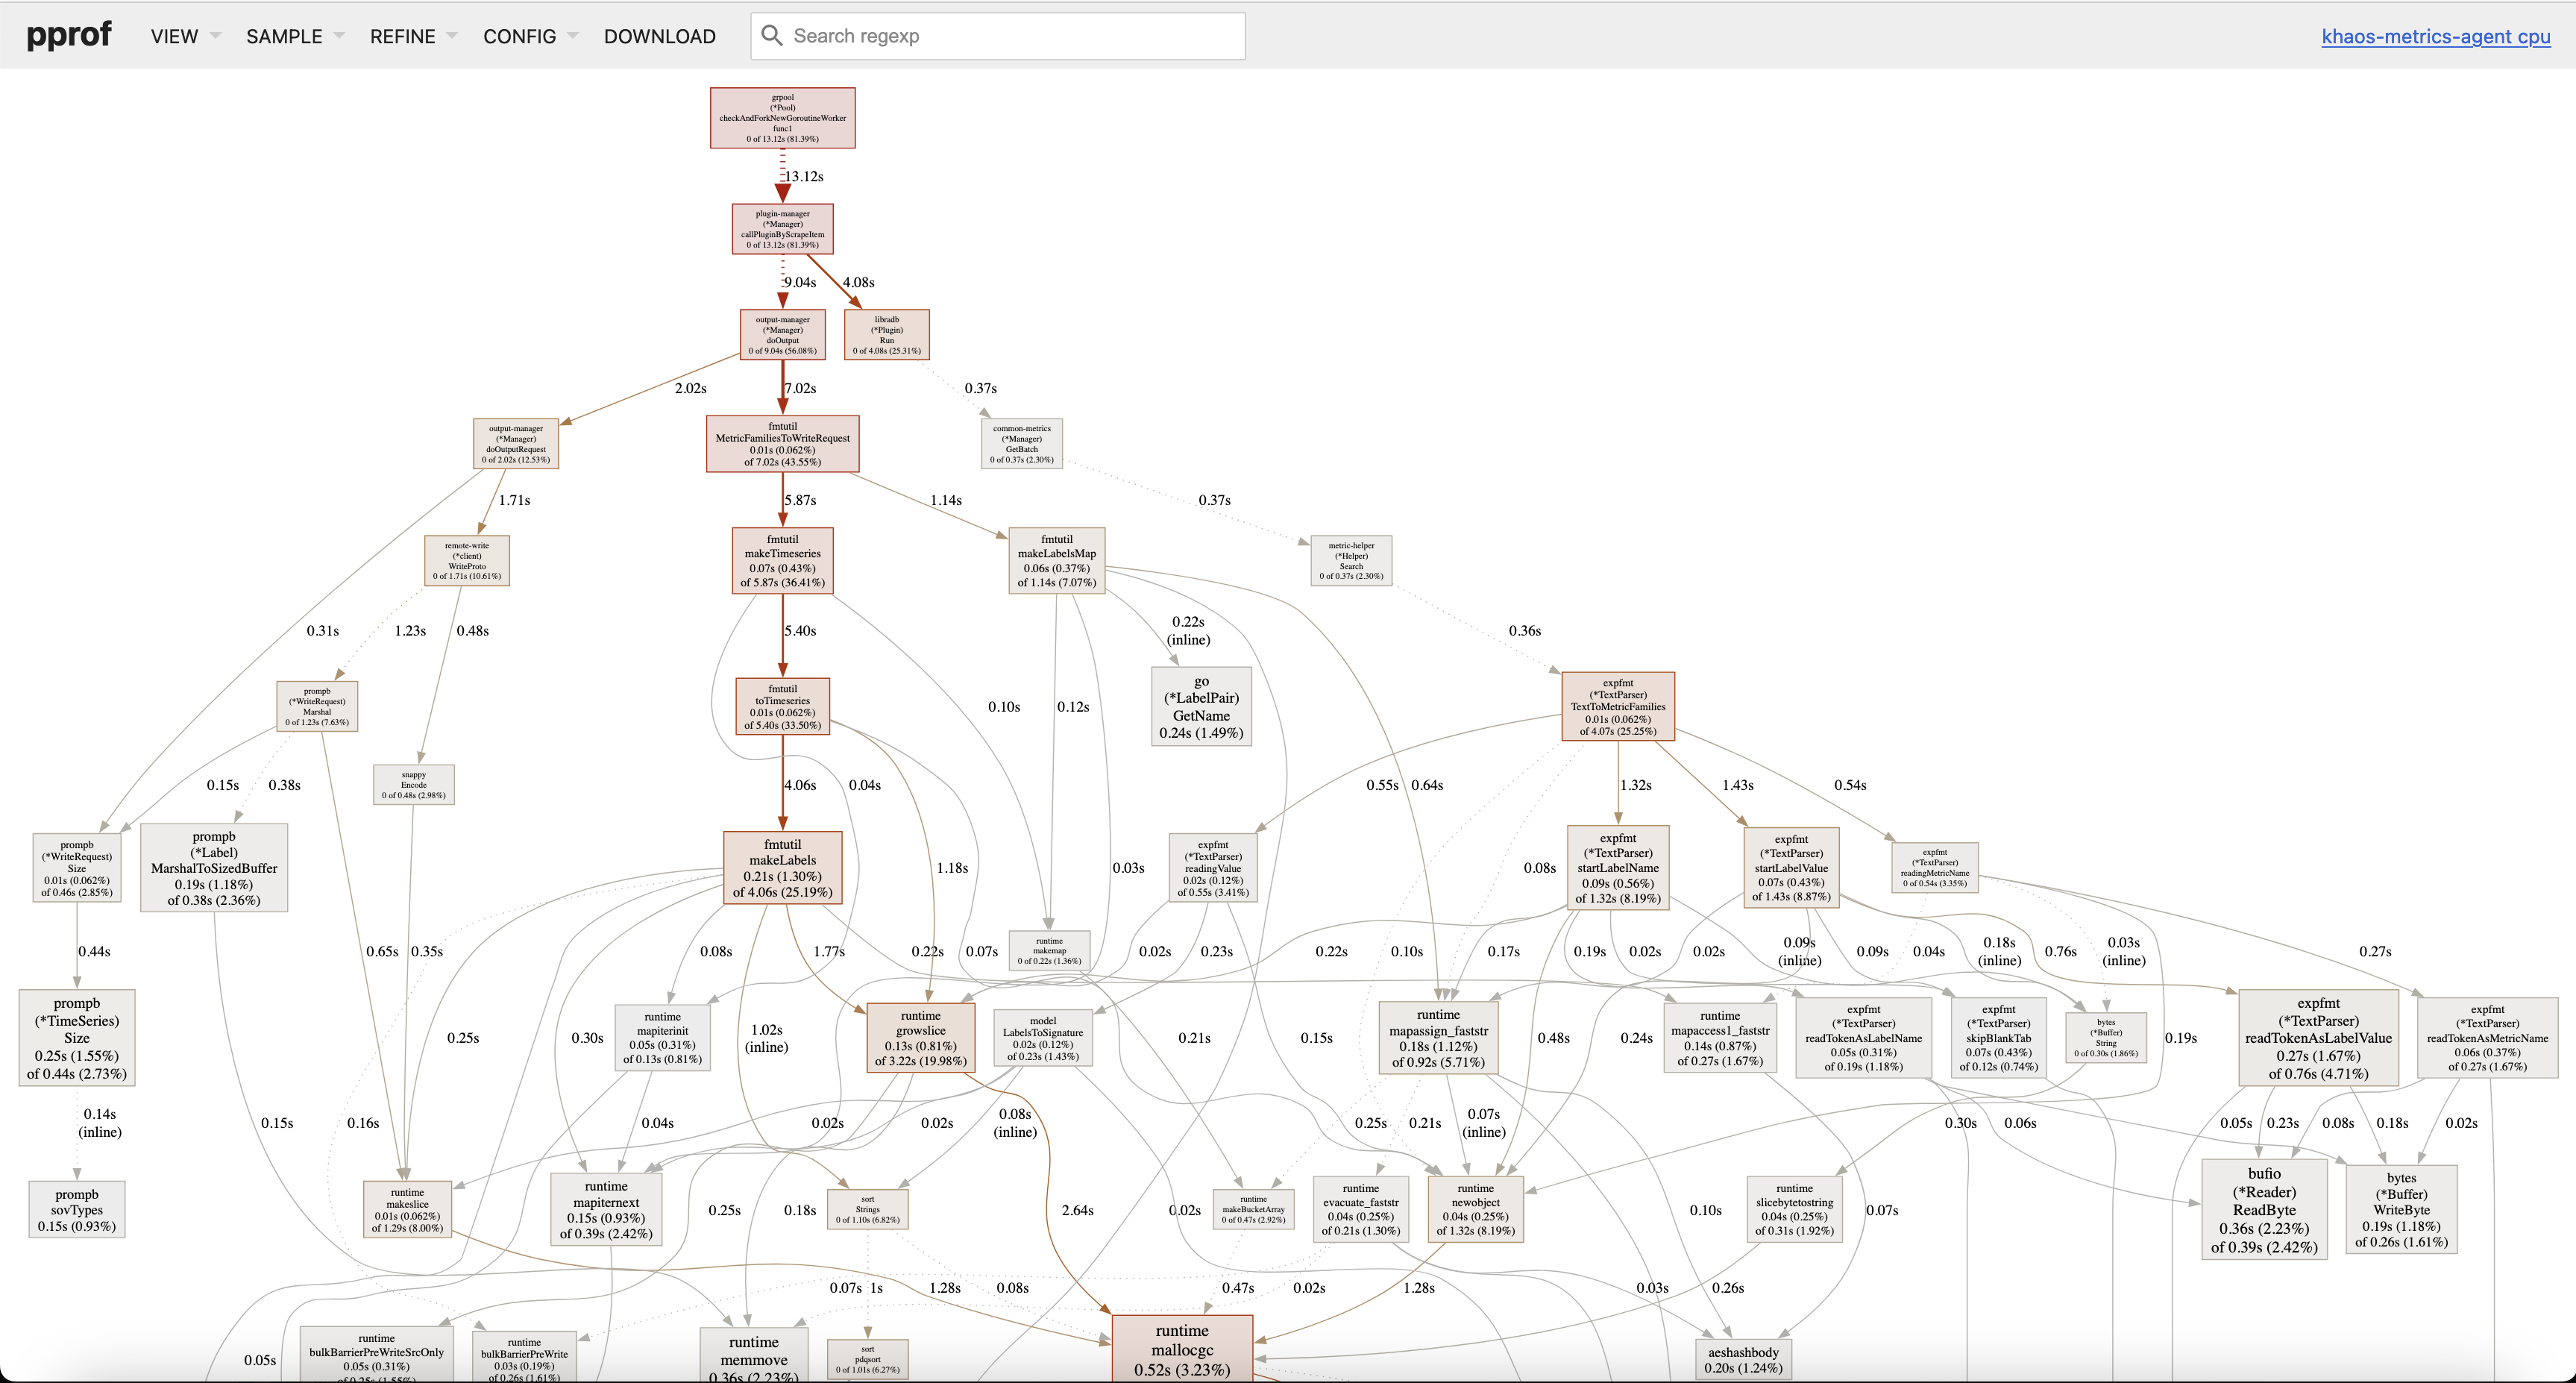
After running, it will open the following graphical API using the default browser, displaying the CPU cost path captured during this period:
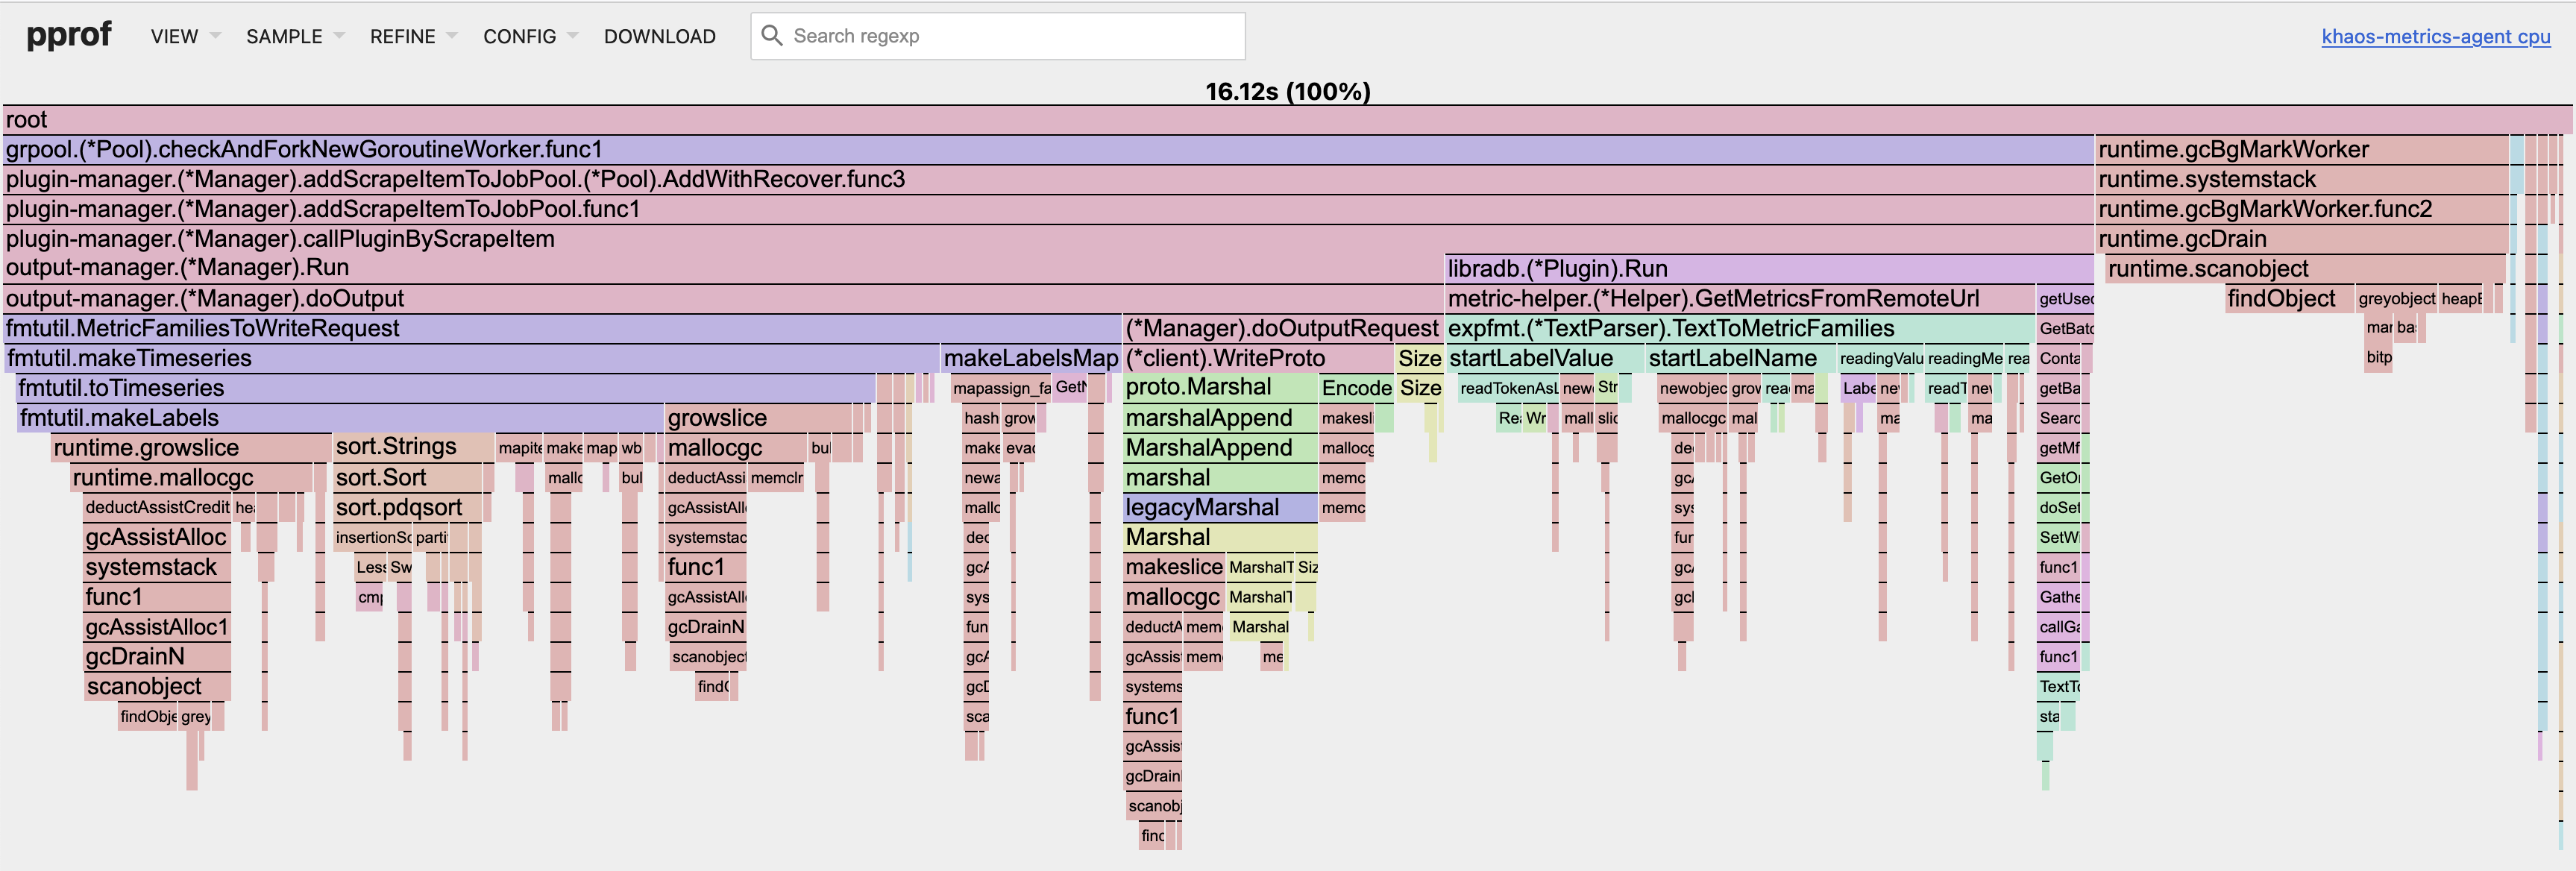
You can also view the flame graph, which might be more illustrative:
Memory Usage Analysis
Similar to CPU performance analysis, memory usage analysis also utilizes the go tool pprof command:
$ go tool pprof -http :8080 "http://127.0.0.1:8199/debug/pprof/heap"
Serving web UI on http://localhost:8080
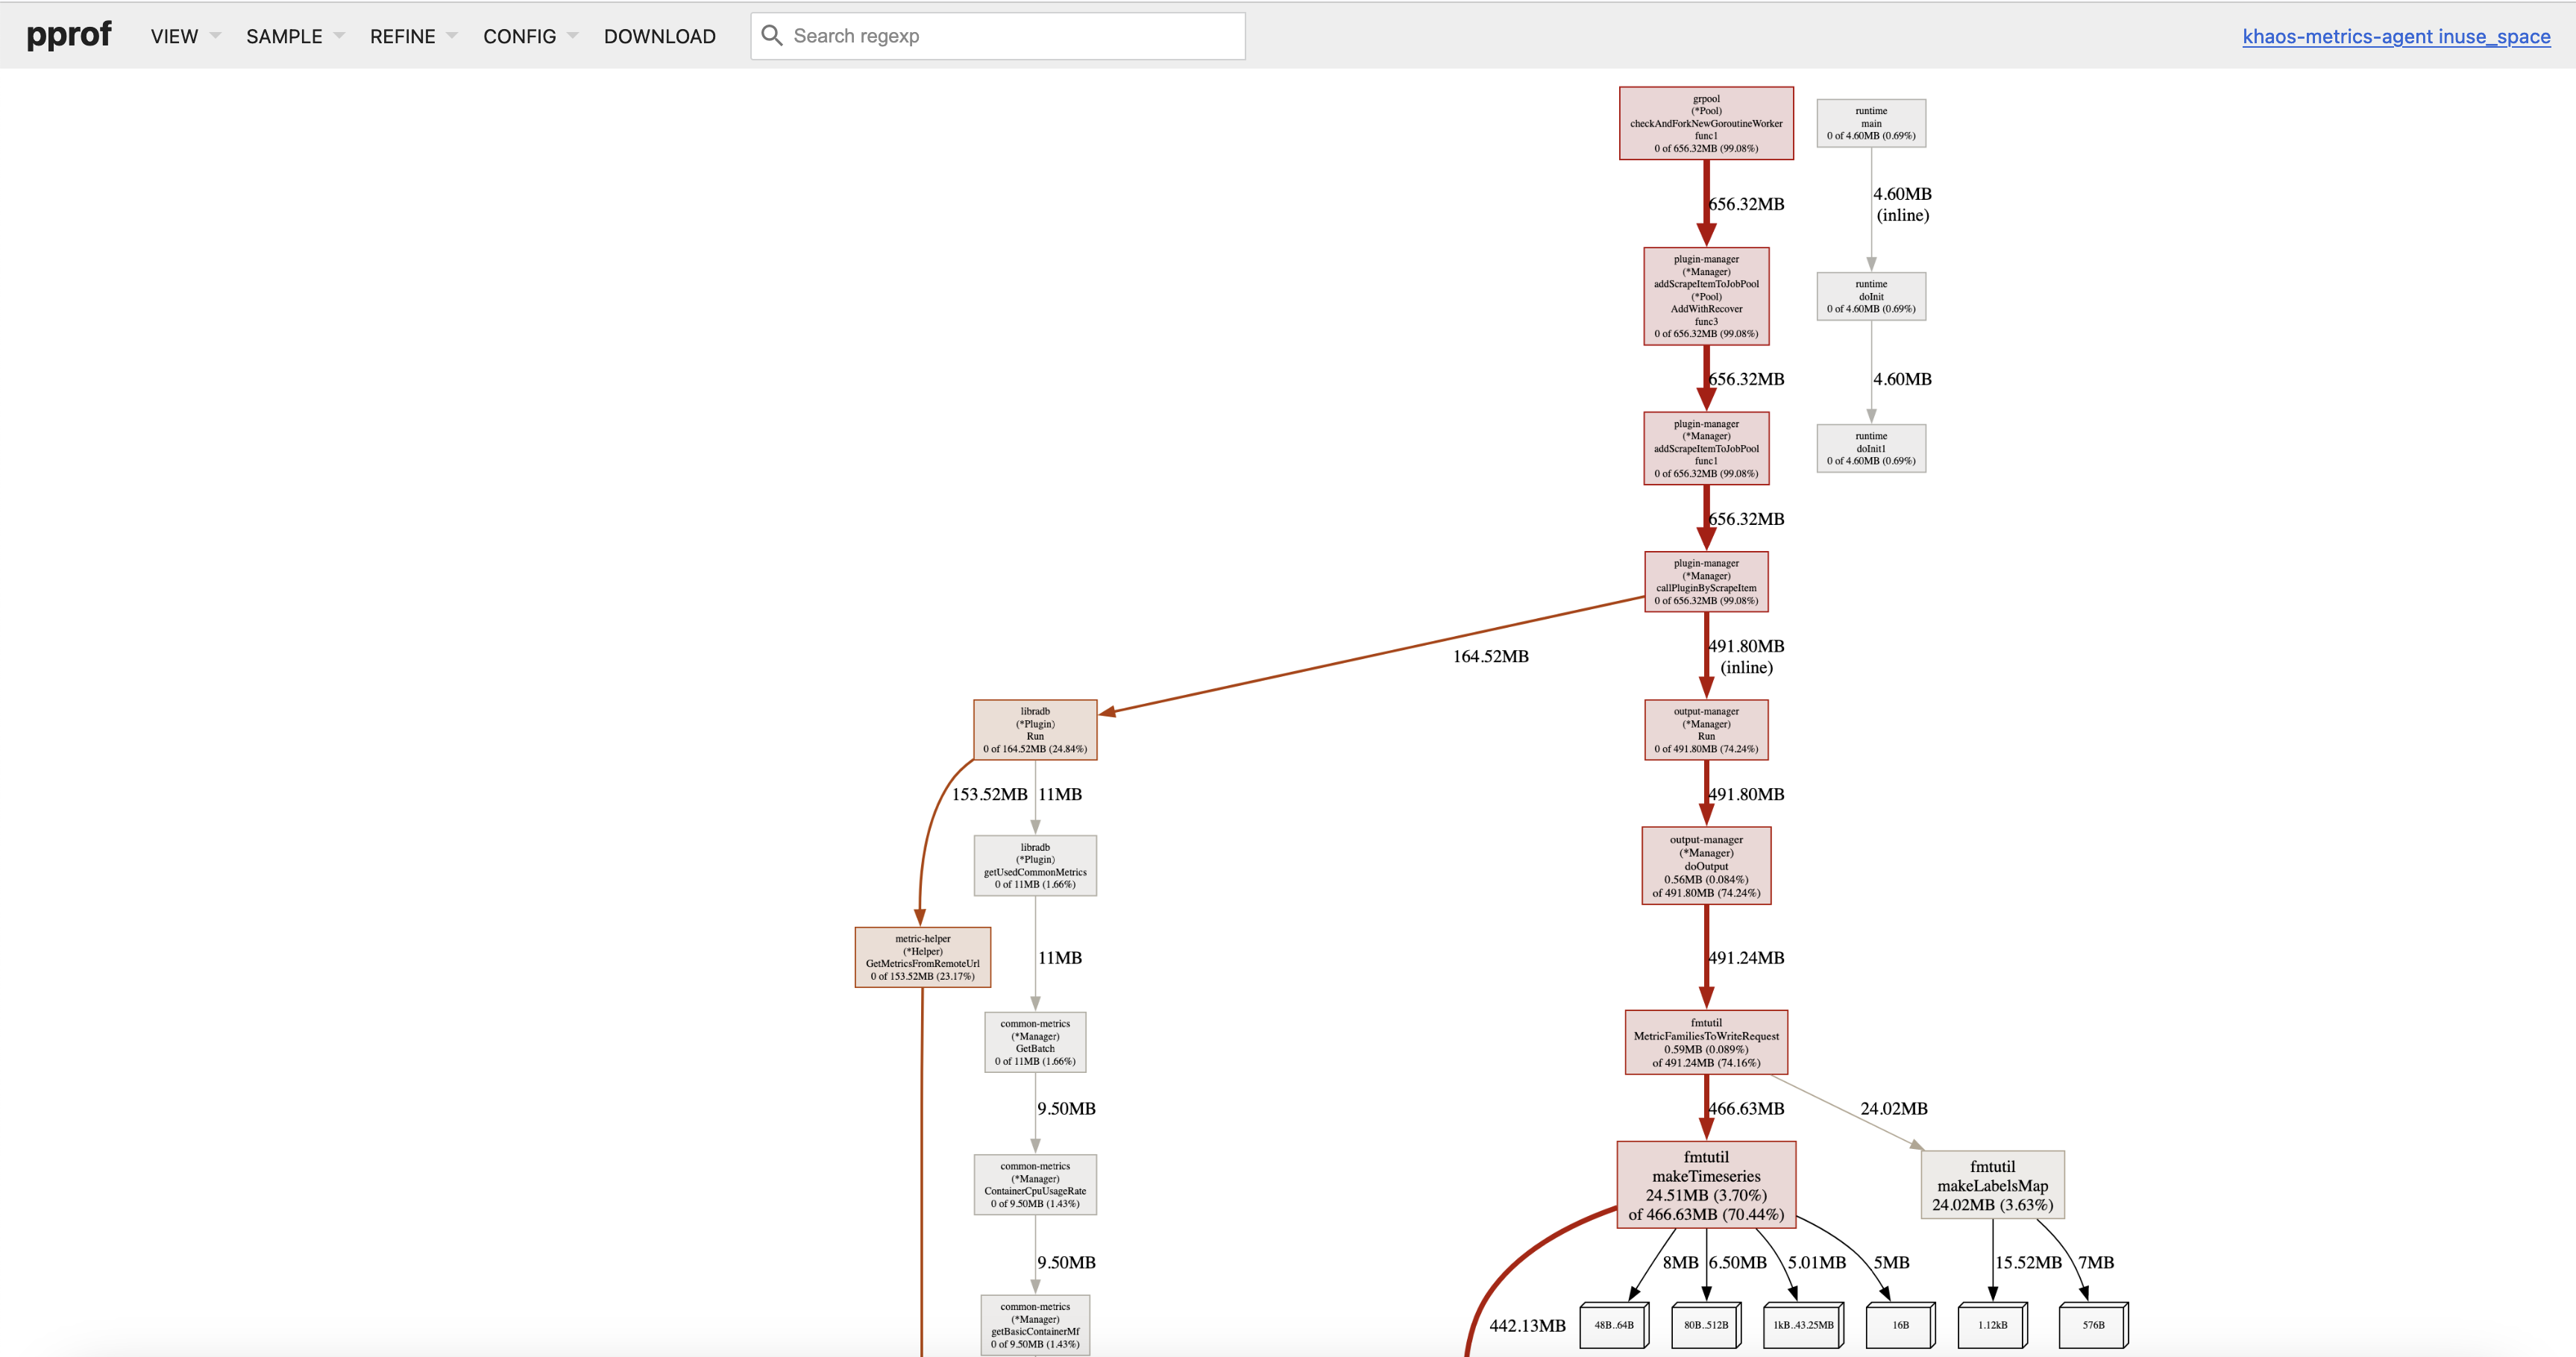
The graphical display is similar to this:
Again, you can view the flame graph, which might be more illustrative:

Goroutine Usage Analysis
Similar to the above analysis, goroutine usage analysis also uses the go tool pprof command:
$ go tool pprof -http :8080 "http://127.0.0.1:8199/debug/pprof/goroutine"
Serving web UI on http://localhost:8080
The graphical display is similar to this, and usually, when looking at goroutines, this graph is sufficient, although there is also a flame graph available.
