GoFrame框架的Web Server提供了非常强大和简便的服务性能分析功能,内部完美集成了pprof性能分析工具,可以在任何时候通过EnablePProf方法启用性能分析特性,并可自定义性能分析工具页面路由地址,不传递路由地址时,默认URI地址为/debug/pprof。
PProf启用
PProf特性的启用会对程序性能产生一定影响,具体影响程度需要根据当前业务场景在PProd启用前后进行对比。
EnablePProf
我们来看一个简单的例子:
package main

import (
	"github.com/gogf/gf/v2/frame/g"
	"github.com/gogf/gf/v2/net/ghttp"
	"runtime"
)

func main() {
	runtime.SetMutexProfileFraction(1) // (非必需)开启对锁调用的跟踪
	runtime.SetBlockProfileRate(1)     // (非必需)开启对阻塞操作的跟踪

	s := g.Server()
	s.EnablePProf()
	s.BindHandler("/", func(r *ghttp.Request) {
		r.Response.Writeln("哈喽世界!")
	})
	s.SetPort(8199)
	s.Run()
}
这个例子使用了s.EnablePProf()启用了性能分析,默认会自动注册以下几个路由规则:
/debug/pprof/*action
/debug/pprof/cmdline
/debug/pprof/profile
/debug/pprof/symbol
/debug/pprof/trace其中/debug/pprof/*action为页面访问的路由,其他几个地址为go tool pprof命令准备的。
StartPProfServer
也可以使用StartPProfServer方法,快速开启一个独立的PProf Server,常用于一些没有HTTP Server的常驻的进程中(例如定时任务、GRPC服务中),可以快速开启一个PProf Server用于程序性能分析。该方法的定义如下:
func StartPProfServer(port int, pattern ...string)
一般的场景是使用异步goroutine运行该PProd Server,即往往是这么来使用:
package main

import (
	"github.com/gogf/gf/v2/net/ghttp"
)

func main() {
	go ghttp.StartPProfServer(8199)
	// 其他服务启动、运行
	// ...
}
以上示例可以改进为:
package main

import (
	"github.com/gogf/gf/v2/frame/g"
	"github.com/gogf/gf/v2/net/ghttp"
)

func main() {
	go ghttp.StartPProfServer(8299)

	s := g.Server()
	s.EnablePProf()
	s.BindHandler("/", func(r *ghttp.Request) {
		r.Response.Writeln("哈喽世界!")
	})
	s.SetPort(8199)
	s.Run()
}
PProf指标
heap: 报告内存分配样本;用于监视当前和历史内存使用情况,并检查内存泄漏。threadcreate: 报告了导致创建新OS线程的程序部分。goroutine: 报告所有当前goroutine的堆栈跟踪。block: 显示goroutine在哪里阻塞同步原语(包括计时器通道)的等待。默认情况下未启用,需要手动调用runtime.SetBlockProfileRate启用。mutex: 报告锁竞争。默认情况下未启用,需要手动调用runtime.SetMutexProfileFraction启用。
PProf页面
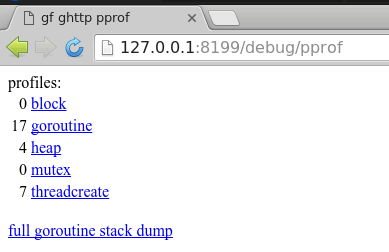
简单的性能分析我们直接访问/debug/pprof地址即可,内容如下:
1、pprof页面
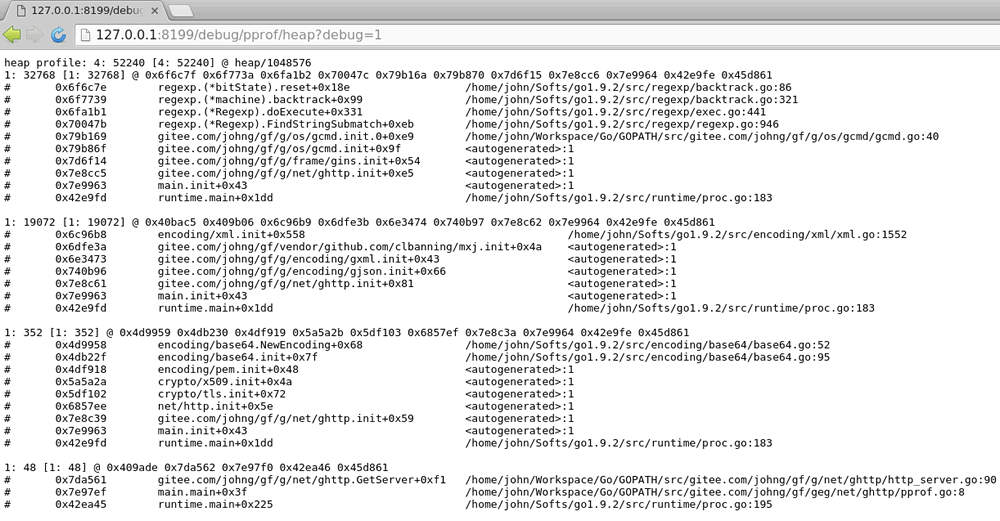
2、堆使用量
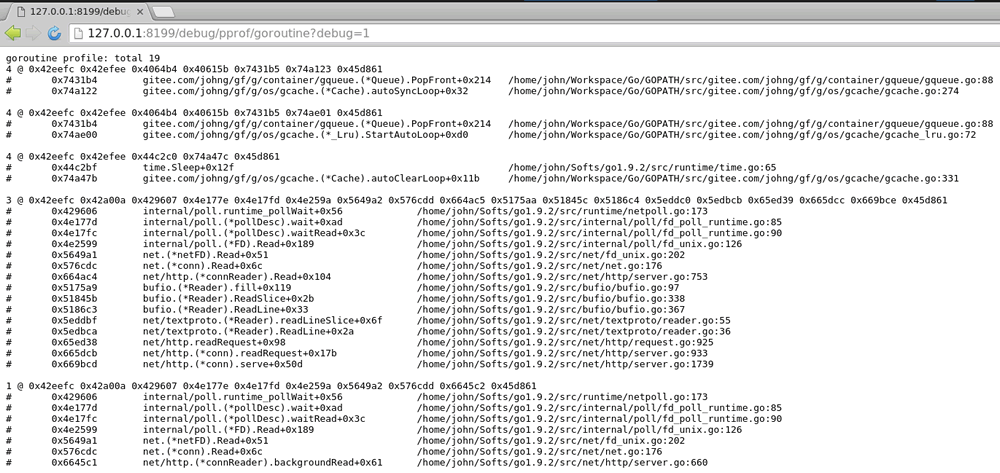
3、当前进程中的goroutine详情
性能采集分析🔥
以下示例截图来源于示例项目,仅供参考。
如果想要进行详细的性能分析,基本上离不开go tool pprof命令行工具的支持,在开启性能分析支持后,我们可以使用以下命令执行性能采集分析:
go tool pprof -http :8080 "http://127.0.0.1:8199/debug/pprof/profile"
也可以将pprof文件导出后再通过go tool pprof命令打开:
curl http://127.0.0.1:8199/debug/pprof/profile > pprof.profile
go tool pprof -http :8080 pprof.profile
执行后profile的pprof工具经过约30秒左右的接口信息采集(这30秒期间WebServer应当有流量进入),然后生成性能分析报告,随后可以通过top10/web等pprof命令查看报告结果,更多命令可使用go tool pprof查看。关于pprof的详细使用介绍,请查看Golang官方:blog.golang.org/profiling-go-programs
CPU性能分析
本示例中的命令行性能分析结果如下:
$ go tool pprof -http :8080 "http://127.0.0.1:8199/debug/pprof/profile"
Serving web UI on http://localhost:8080
图形化展示pprof需要安装Graphviz图形化工具,以我目前的系统为Ubuntu为例,直接执行sudo apt-get install graphviz命令即可安装完成图形化工具(如果是MacOS,使用brew install Graphviz安装)。
运行后将会使用默认的浏览器打开以下图形界面,展示这段时间抓取的CPU开销链路:

也可以查看火炬图,可能更形象一些:

内存使用分析
与CPU性能分析类似,内存使用分析同样使用到go tool pprof命令:
$ go tool pprof -http :8080 "http://127.0.0.1:8199/debug/pprof/heap"
Serving web UI on http://localhost:8080
图形展示类似这样的:

同样的,也可以查看火炬图,可能更形象一些:

goroutine使用分析
与上面的分析类似,goroutine使用分析同样使用到go tool pprof命令:
$ go tool pprof -http :8080 "http://127.0.0.1:8199/debug/pprof/goroutine"
Serving web UI on http://localhost:8080
图形展示类似这样的,通常goroutine看这个图的话就差不多了,当然也有火炬图。

4 コメント
刘羽禅
这个工具 可以看到某个API请求 代码执行过程中的 所有SQL语句吗? 并给出每条SQL语句的执行耗时时间.
小陈
gf框架每个组件都是耦合的, 感觉想要实现你的功能, 就没法耦合了.
郭强
goframe框架的每个组件包是解耦设计的,除了g包。郭强
这个是常见需求,但
pprof不能实现你想要的,但是goframe的数据库组件默认自带链路跟踪,通过traceid可以实现你的需求。